Information graphics (or infographics) are graphical depictions of data and information. By presenting information in a compact and creative approach, infographics are able to quickly convey knowledge and engage its viewers. Infographics are highly likely to receive star ratings because they’re easy to understand, quicker to read through, and require less effort.
In this collection, you’ll find forty beautiful and educational infographics, displaying the uncommon spectacle of “art meets science”.
1. Coffee Drinks Illustrated
The proportion of ingredients for popular coffee drinks and their pronunciation keys. 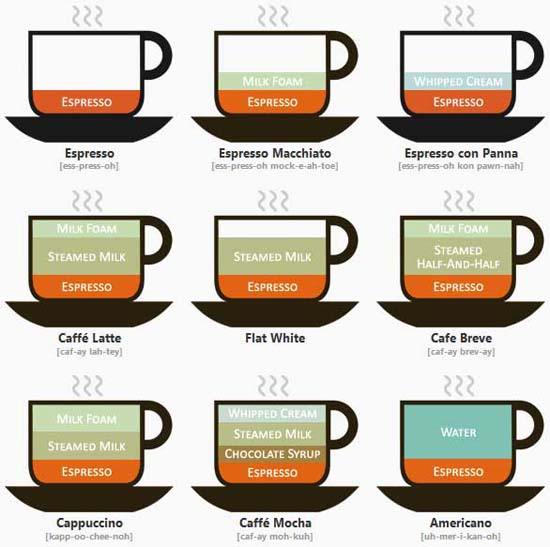
2. Piggy Trouble
This infographic showcases the history of the Swine Flu, starting from 1976. 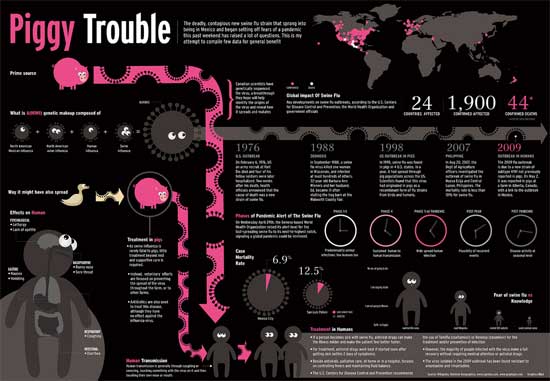
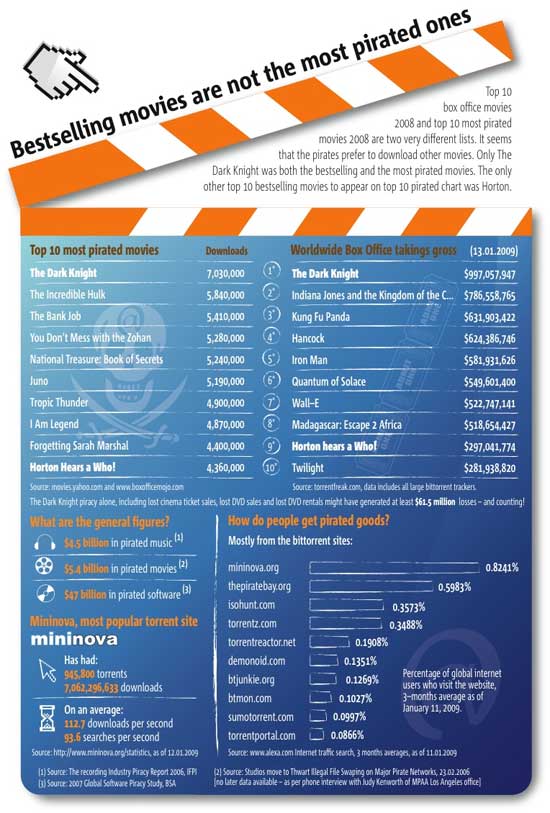
3. Best selling movies are not the most pirated ones
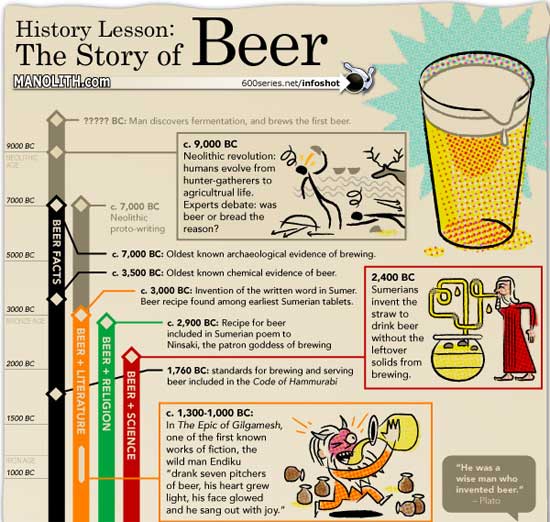
4. History Lesson: The Story of Beer
5. The Best Beer in America
The top breweries and beers in the U.S. 
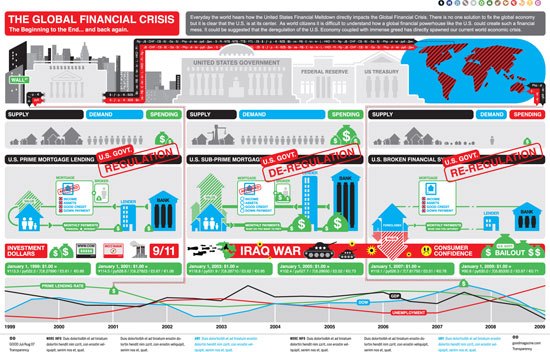
6. Making Sense of the Financial Mess: The Global Financial Crisis
7. 389 Years Ago
A rundown of the historic events in African-American culture. 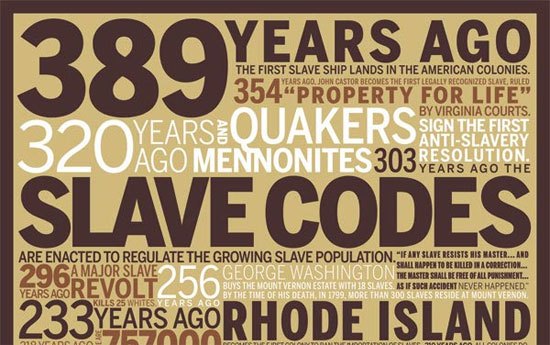
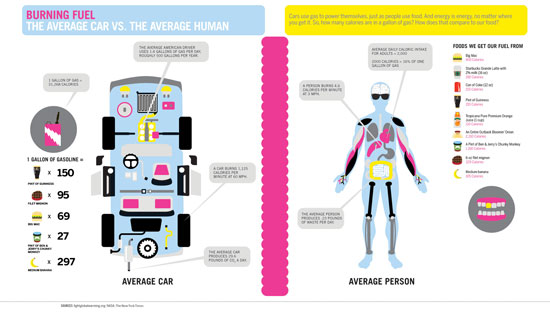
8. Burning Fuel: The Average Car vs. The Average Human
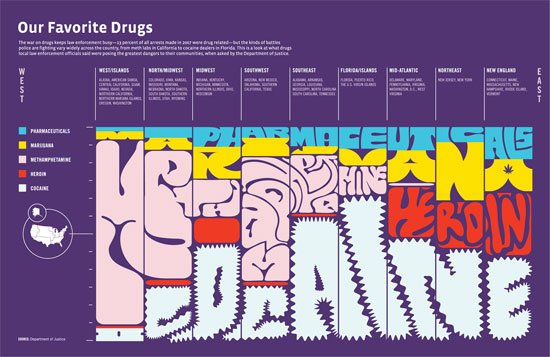
9. Our Favorite Drugs
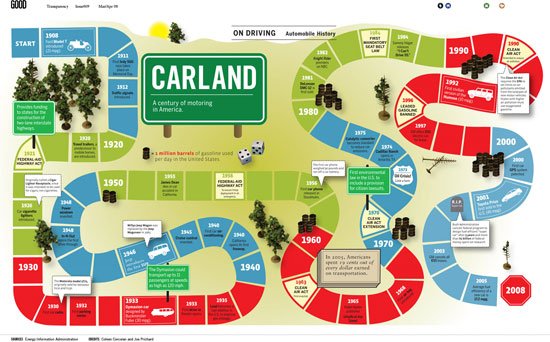
10. On Driving: Automobile History
11. TheGlobalWarming Infographic
An illustrated guide at how the Global Warming phenomenon works. 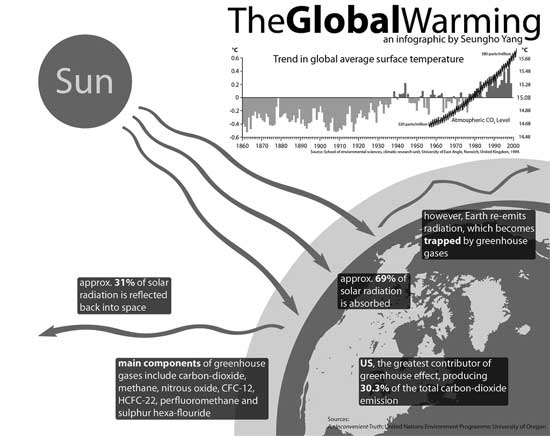
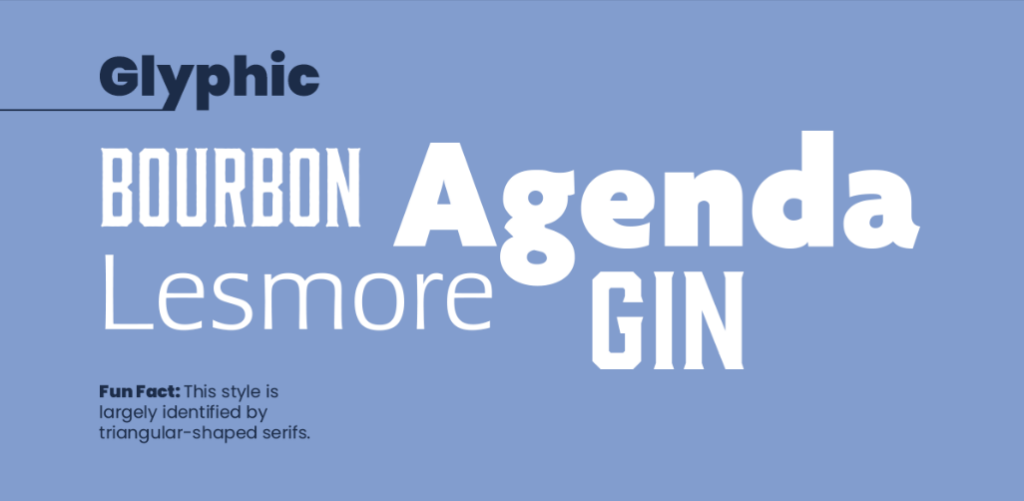
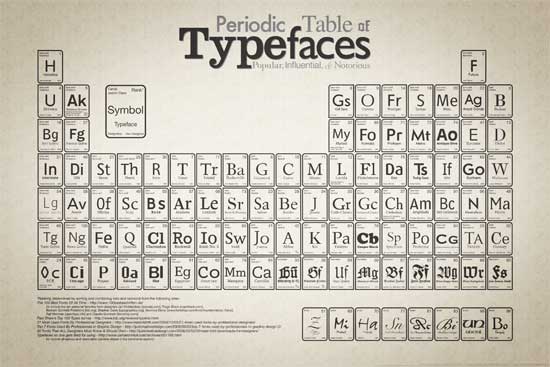
12. Periodic Table of Typefaces
13. SSSMOKIN! The Global Tobacco Trade
A packed visual piece on tobacco chemicals and tobacco trade worldwide. 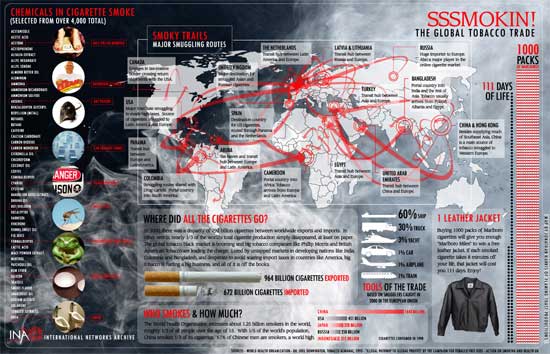
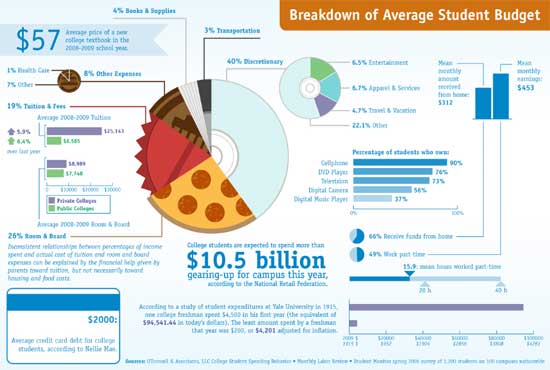
15. Breakdown of Average Student Budget
16. Who’s Buying That?
A graphical representation of consumer spending across the globe. 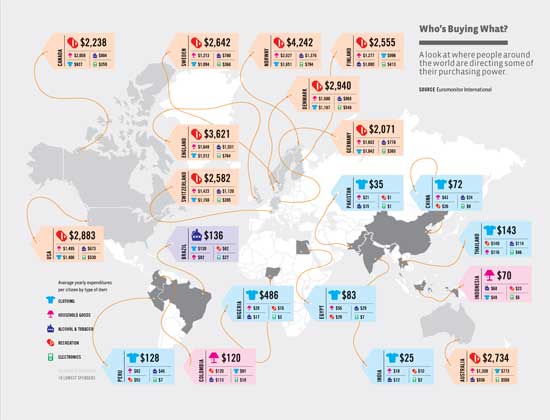
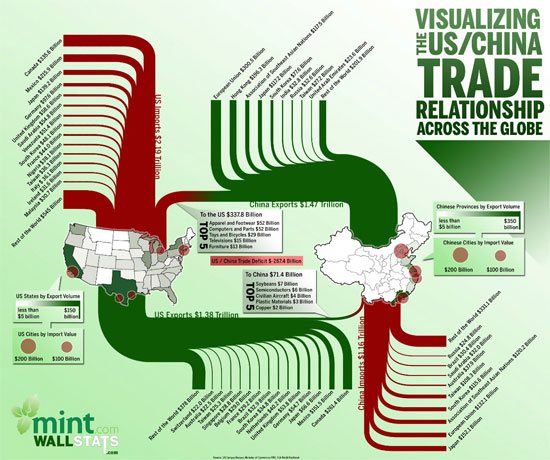
17. Visualizing the US and China Trade Relations
18. Get to Know Your Street Vendors
The types of street vendors and/or restaurants you may encounter in urban cities of the U.S. 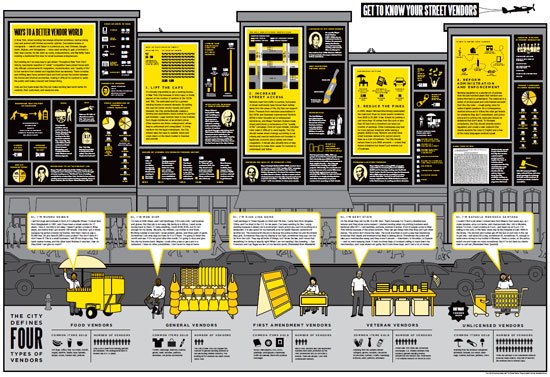
19. Where we live
The distribution of the population in the U.S. 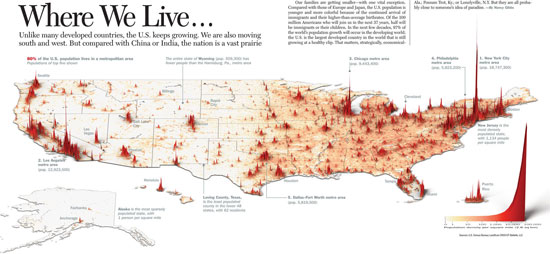
20. Who’s Coming to America?
The top nationalities that immigrate to the U.S. 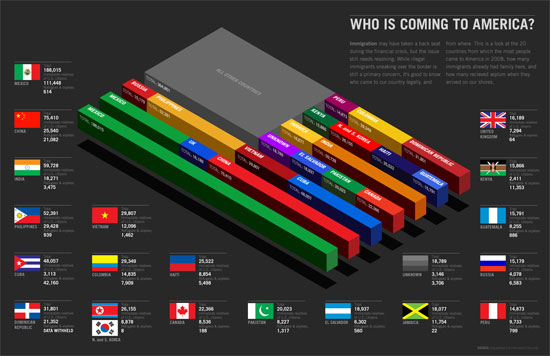
21. Global Internet Traffic Flow Map
An infographic on internet information flow around the world. 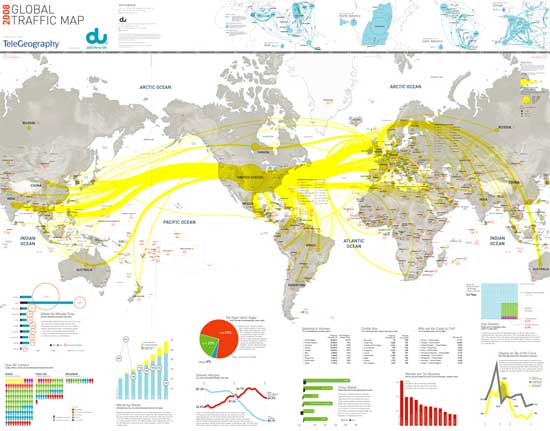
22. Classifying Experiences
This is in PDF format. An informative graphical piece on User Experience (UX). 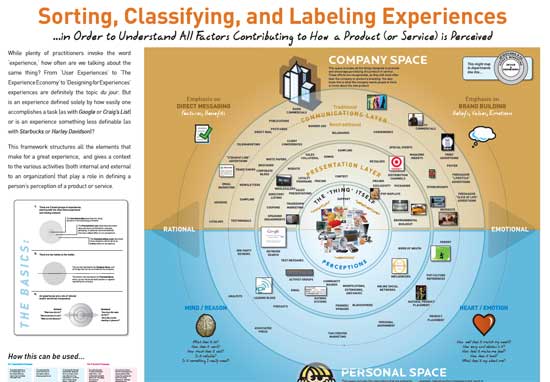
23. Black Hawk Down
An illustrated guide to the events that happened in Somalia in 1993 when a U.S. helicopter was shot down by rebels. 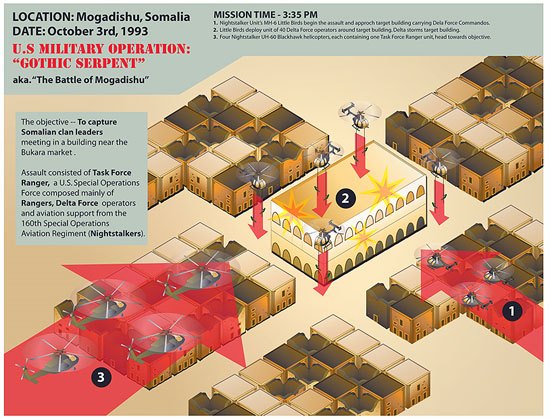
24. A Year in Iraq
A visualization of fatalities related to the War in Iraq. 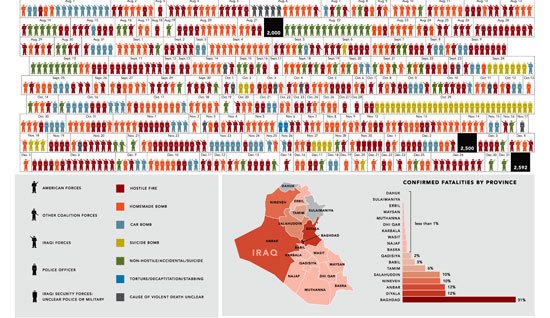
25. Glass Half Empty: The Coming Water Wars
An infographic on the global water shortage crisis. 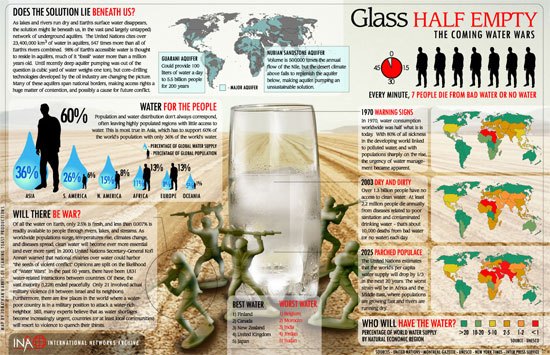
26. The Magic Bean Shop & The Fries That Bind Us
A graphical representation of how Starbucks and McDonald’s are proliferating across the globe. 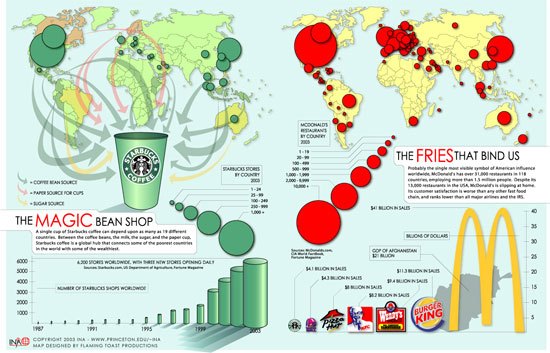
27. Cover Drive
An informative piece on insurance. 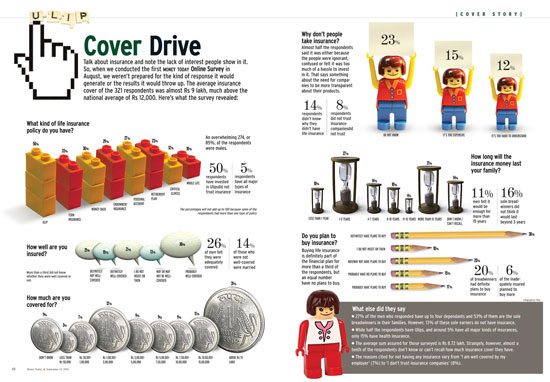
28. What’s in the Customer’s Mailstream?
This is a PDF file, infographic on page 4. This piece shows a breakdown of what people get in the mail. 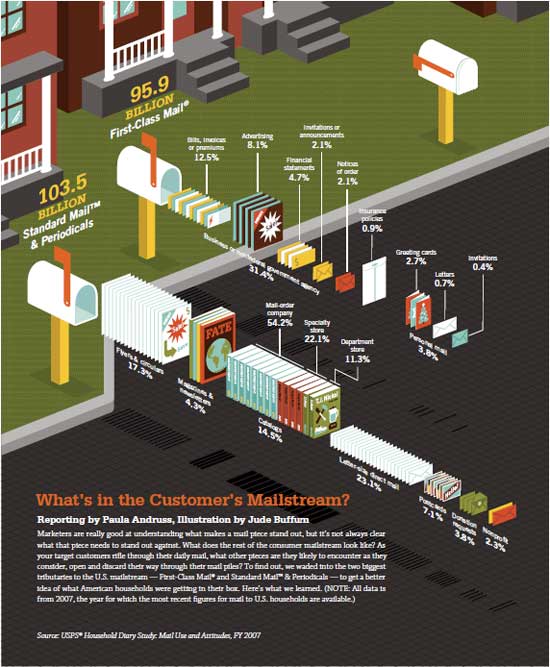
29. Flickr User Model
Networking connection of users on Flickr. 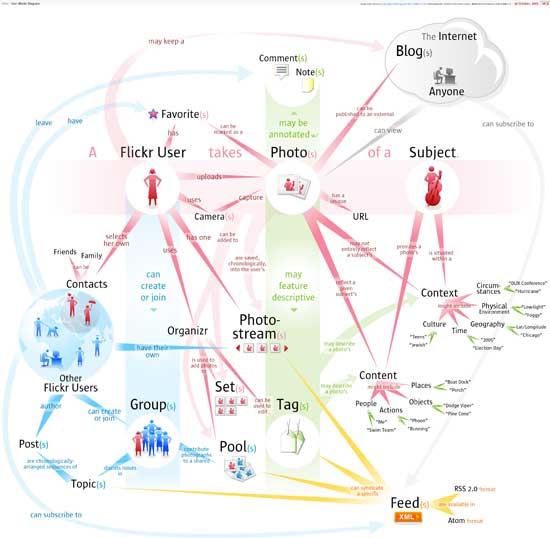
30. Disney World’s Huge Footprint
The cost in resources of Disney World operations. 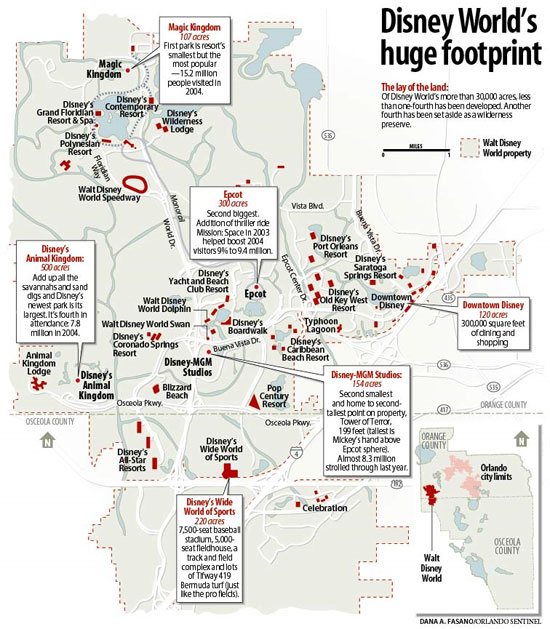
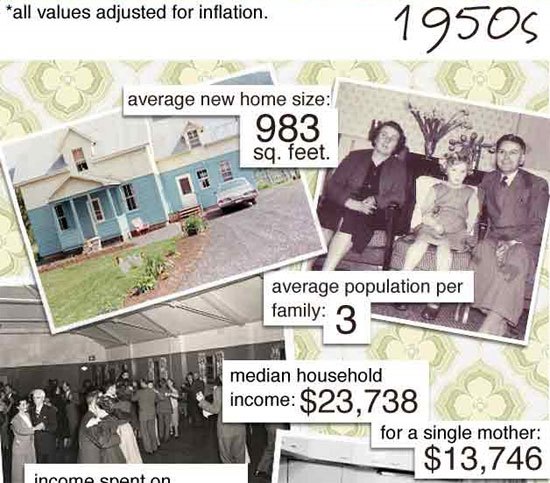
31. Evolution of the Household – 1950’s to Present
32. The Pyramid of Internet Piracy
This is a PDF file. A piece on the structure of the people participating in internet piracy. 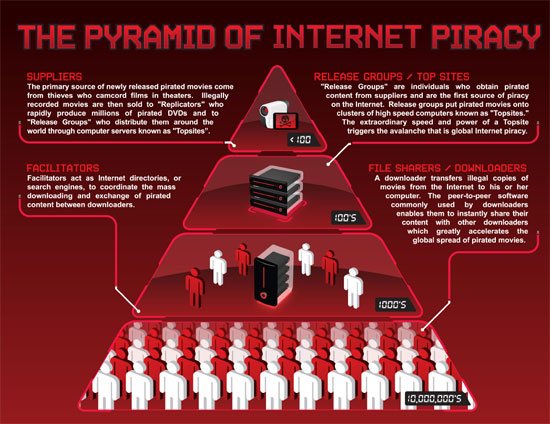
33. Making Sense of the Financial Mess: Where Did All The Money Go?
An illustrated guide on how the financial crisis started. 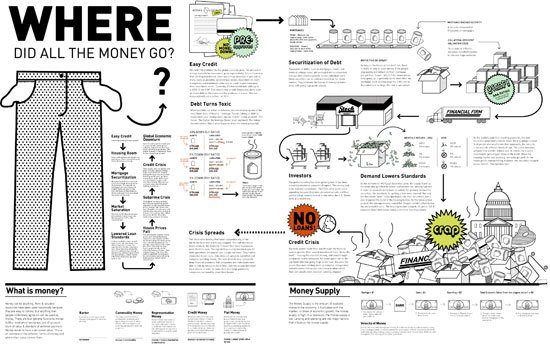
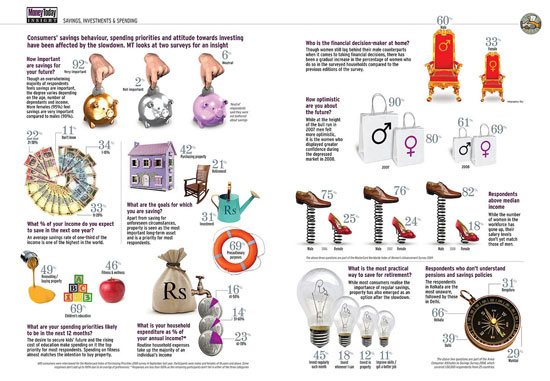
34. Consumers’ Savings Behaviors
35. A Visual Guide to Pissing Off The Financial World
An infographic on the history of AIG. 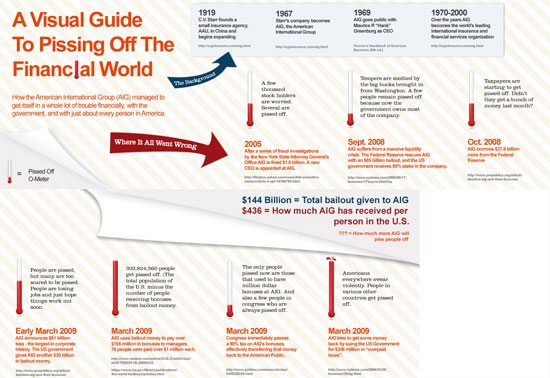
36. Anatomy of an Energy-Efficient Home

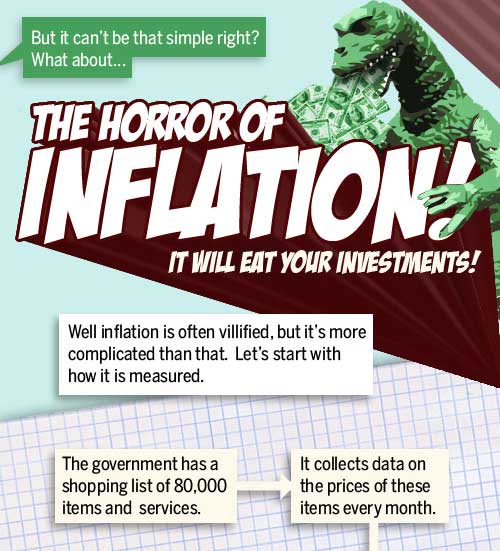
37. A Visual Guide to Inflation
38. Web Trend Map 4
A graphical representation of the top 50 most influential websites. 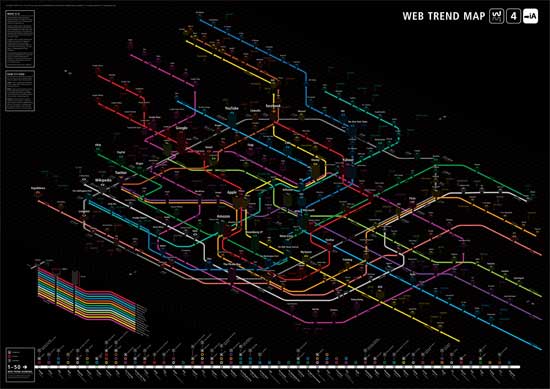
39. Employment-Based Immigration Chart
A visual guide on how to immigrate to the U.S. based on employment. 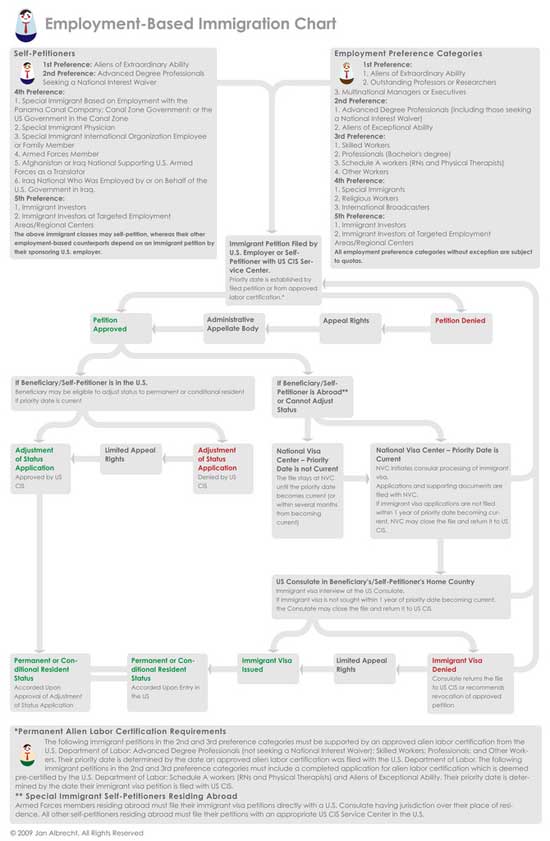
40. Where to Cut
Consumer spending trends juxtaposed with Indian consumers. 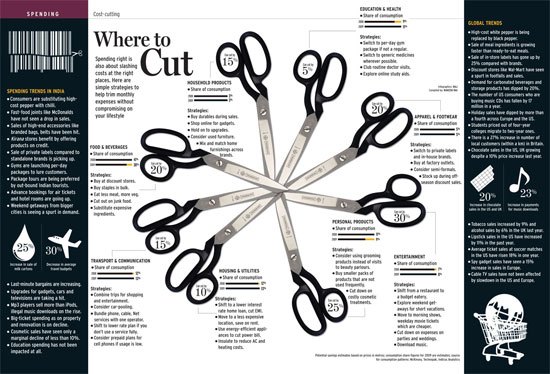
Resources on infographics
- Information graphics – Wikipedia
- Cool Infographics – A weblog in infographics
- GOOD – Good is a magazine that often presents creative infographics.
- Flickr Diagram Diaries group – a group on diagrams.
- FlowingData – A site dedicated to the presentation of data
Related content
-
 President of WebFX. Bill has over 25 years of experience in the Internet marketing industry specializing in SEO, UX, information architecture, marketing automation and more. William’s background in scientific computing and education from Shippensburg and MIT provided the foundation for MarketingCloudFX and other key research and development projects at WebFX.
 -

WebFX is a full-service marketing agency with 1,100+ client reviews and a 4.9-star rating on Clutch! Find out how our expert team and revenue-accelerating tech can drive results for you! Learn more
Make estimating web design costs easy
Website design costs can be tricky to nail down. Get an instant estimate for a custom web design with our free website design cost calculator!
Try Our Free Web Design Cost Calculator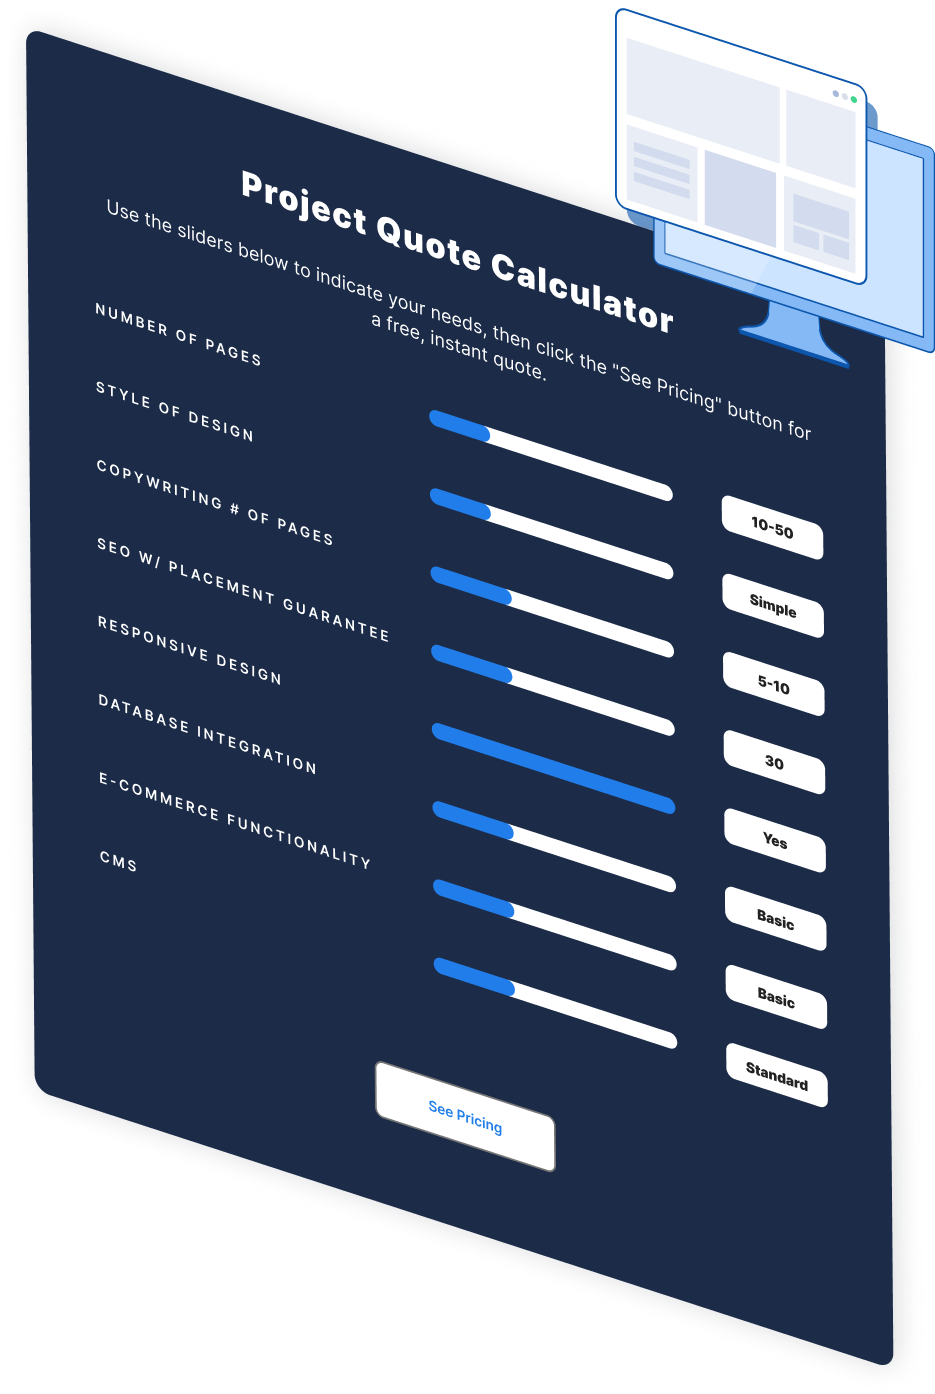
Share this article


Web Design Calculator
Use our free tool to get a free, instant quote in under 60 seconds.
View Web Design CalculatorMake estimating web design costs easy
Website design costs can be tricky to nail down. Get an instant estimate for a custom web design with our free website design cost calculator!
Try Our Free Web Design Cost Calculator