There are plenty of JavaScript libraries out there for rendering your otherwise plain and boring numerical data into beautiful, interactive, and informative visualizations. The beauty of using JavaScript for data visualization is that, if created correctly, your data will be highly accessible (usually via HTML tables). A long time ago (2008), I wrote about JavaScript solutions for graphing and charting data and this article revisits the topic with twenty more JavaScript libraries that you can use to bring your data to life, all for no cost.
1. Highcharts
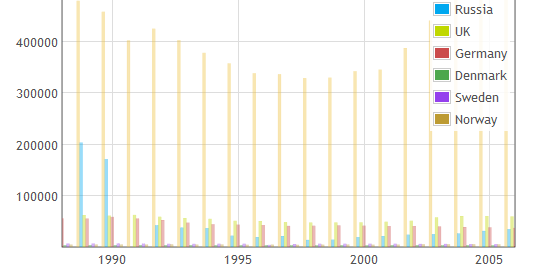
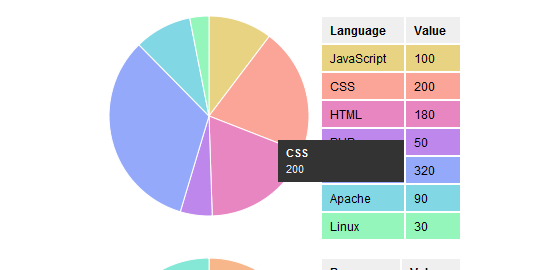
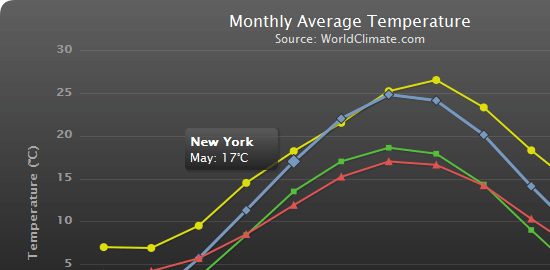 Highcharts is one of the most promising JavaScript charting libraries to hit the scene recently, with its large array of features including seven charting types (line, pie, and bar among them), the ability to zoom in and out of charts, and tooltips for offering more information about data points. The library has many options for customization and they’re well documented on one page for easy referencing.
- Highcharts Demo
- Highcharts Download
2. gRaphaël
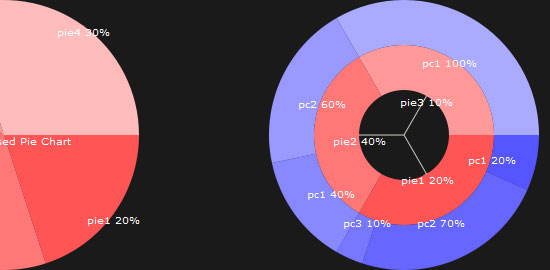
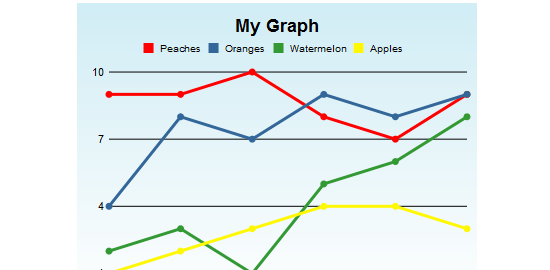
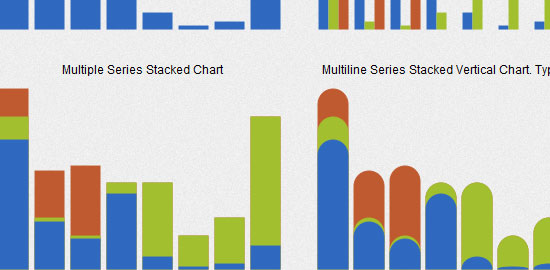 gRaphaël is a charting library based on Raphaël, a vector graphics drawing JavaScript library. The library is divided into sub-libraries so that you can just download the type of chart that you’re interesting in creating. With the main library, g.raphael.js, at only 12KB and sub-libraries between 4KB to 8KB, this can be a lightweight but fully featured JavaScript charting solution for web developers.
- gRaphaël Demo
- gRaphaël Download
3. JavaScript InfoVis Toolkit
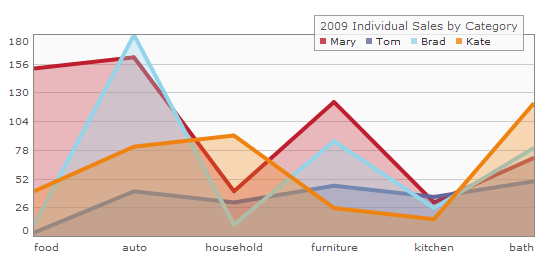
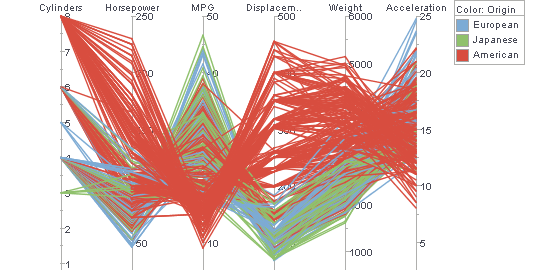
 JavaScript InfoVis, a charting library influenced partly by MooTools, is a robust and excellent solution for data visualization. It’s modular (just like MooTools) so that you can include just the parts you need to keep your pages light. It has animation effects capability to captivate and engage your users, plenty of charting types, a helper class for working with JSON data, and much more.
- JavaScript InfoVis Toolkit Demo
- JavaScript InfoVis Toolkit Download
4. jQuery Visualize Plugin
 If you’re already using jQuery, it’d be performance conscious of you to look into plugins for your visualization requirements. jQuery Visualize, a plugin developed by the Filament Group (the core developers of jQuery UI), is a jQuery plugin for generating charts using HTML5’s canvas element. It has 14 options for customizing your charts.
Don’t forget to try out their Configurable demo.
- jQuery Visualize Plugin Demo
- jQuery Visualize Plugin Download
5. moochart
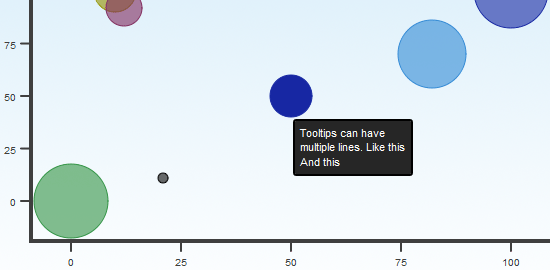 For now, moochart only plots bubble diagrams, but there are plans to expand this MooTools 1.2 plugin to feature pie, line, and bar graphs. The plugin has 14 options that you can use for customizing your diagram’s look, and tooltips for providing more information about a bubble when mousing over them. moochart is open source and released under the MIT license.
- moochart Demo
- moochart Download
6. JS Charts
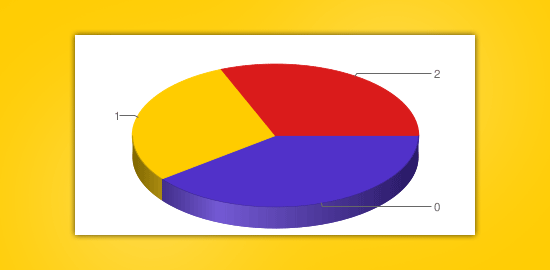
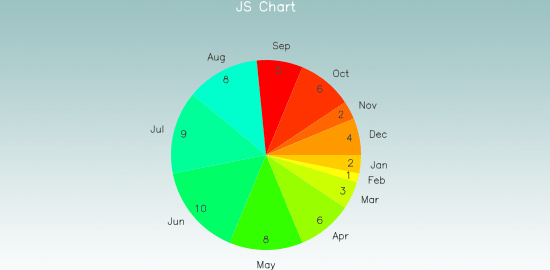 JS Charts boasts easy usage by emphasizing on the end-user’s ability to use the library with little to no coding, making it ideal for web designers who’d like to chart data without spending too much time learning how to write JavaScript. JS Charts has a web-based GUI and offers hosting for your charts to take some load off your own servers. It supports three chart types: bar, pie, and line.
7. dygraphs
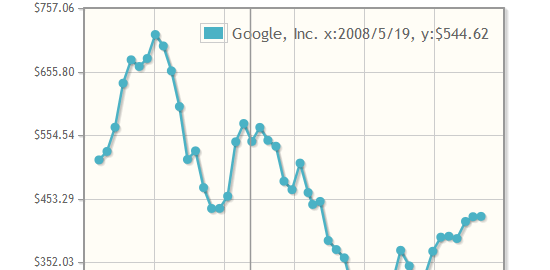
 dygraphs is a JavaScript visualization library for producing interactive charts for time series data. It was designed to plot dense data sets (such as temperature fluctuations). It has user interfacing options such giving the user the ability to specify time intervals on the fly, displaying of values when mousing over parts of the chart, and zooming.
It also integrates with the Google Visualization API.
- dygraphs Demo
- dygraphics Downloads
8. JSXGraph
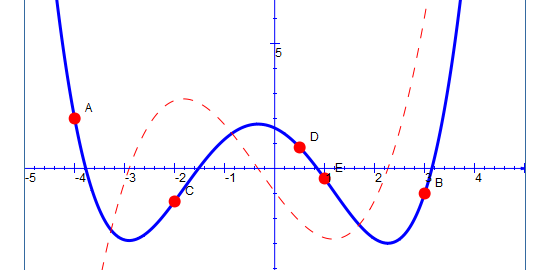 JSXGraph, developed at the University of Bayreuth in Germany, is a standalone JavaScript library for plotting complex geometric shapes and data such as Bezier curves, differential equations, and much more. It has animation features for moving graphs, interactive components such as sliders for experimenting with changing values of variables, and plenty of charting types to choose from.
- JSXGraph Demo
- JSXGraph Download
9. Protochart
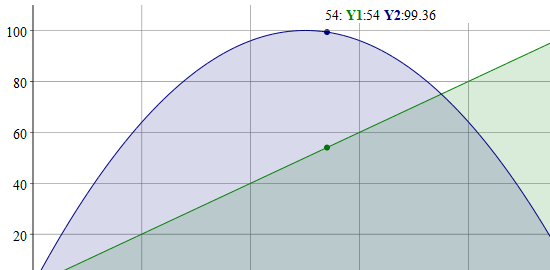
 Protochart is a JavaScript library for use with the Prototype JS framework. It uses HTML5’s canvas for modern browsers, and the ExCanvas library for Internet Explorer support. It has six types of charts including line, pie, bars, points, lines with points, and area graphs.
It allows for the display of legends that are highly configurable to help identify items on your charts.
- Protochart Demo
- Protochart Download
10. Bluff
 Bluff is a lightweight charting library that ports Ruby’s Gruff gem to JavaScript. Weighing at only 11KB gzip’ed (you also need JS.Class which only weighs 2.6KB gzip’ed), it’s surprising that you’ll be able to get 15 different types of charts out of this library. It features tooltips, a ton of configurable options, legend support, and the .set_theme method for declaring reusable themes.
11. Style Chart
 Style Chart is a free JavaScript-based charting web service/API for creating hosted charts. It’s also available as a downloadable library in case you want to host your own charts (though you need to register in order to download it). It has the things you’d expect from a robust and configurable charting library such as tooltips, legends, and 19 types of charts including 3D pie, 3D bar graphs and Pareto charts.
12. jqPlot
 jqPlot is another jQuery plugin for data visualization developed by Chris Leonello. It’s open source, embodying two sets of licensing: MIT and GPL version 2. It has many options for you to take advantage of in order to truly customize your charts.
- jqPlot Demos
- jqPlot Download
13. jQuery Sparklines
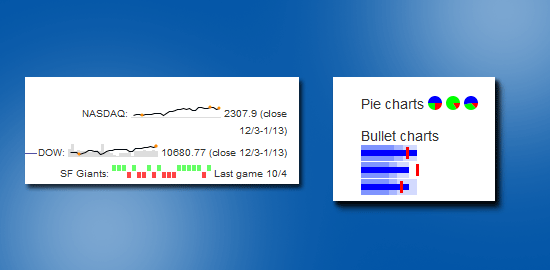 jQuery Sparklines is a simple and lightweight jQuery plugin for charting dynamic sparklines (a condensed data graphic). It emphasizes on ease of use and minimal coding; you can create complex sparklines with as little as one line of JavaScript code. When minified and gzip’ed, the plugin only weights 4.7KB so it won’t bog down your page response times much.
14. jQuery Google Charts
 jQuery Google Charts (abbreviated as jGCharts), developed by Massimiliano Balestrieri, is a data visualization jQuery plugin for working with the Google Charts API. It has plenty of chart types, including a 3D pie chart that’s dynamically generated. It has a GUI in development (still in alpha release), which will allow you to create charts easily with a graphical front-end.
- jQuery Google Charts Demo
- jQuery Google Charts Download
15. Canvas Pie Chart with Tooltips
 This MooTools class/plugin is for plotting pie charts using the canvas element. It’s based on Canvas pie by Stoyan Stefanov. It’s a simple and straightforward data visualization option for MooTools developers who are only interested in plotting out pie charts.
- Canvas Pie Chart with Tooltips Demo and Download
16. TufteGraph
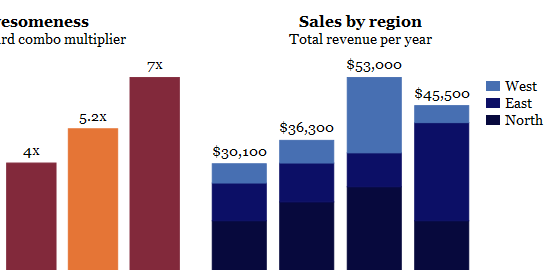 TufteGraph is a jQuery plugin that emphasizes on ease of use and minimalism. It offers you only a few options for styling and instead relies on CSS for customizing the look and feel of your graphs, which ultimately means that your web pages will render faster because JS has to work less. Check out this introduction video to TufteGraph.
17. Timeline
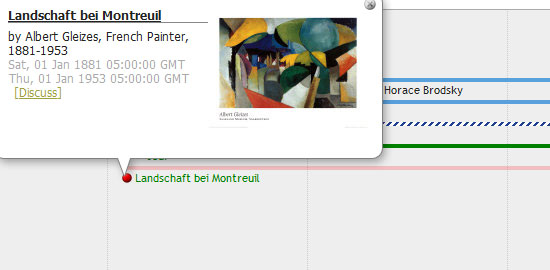 Timeline is a JavaScript widget for creating interactive timelines. You can scroll through items featured in chronological order by using your mousewheel or by holding down your mouse button on the timeline and dragging left or right. Clicking on a dot, which represents an item in the time line, will reveal more information.
Timeline is open source, released under the BSD license.
- Timeline Demos
- Timeline Download
18. Protovis
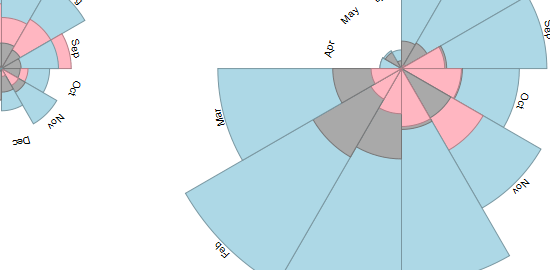 Protovis is a data visualization library for charting data. Protovis was created by the Stanford Visualization Group. It uses JavaScript and SVG to dynamically plot out your data.
Protovis is open source released under the BSD license. You can download the source on their home page.
19. milkchart
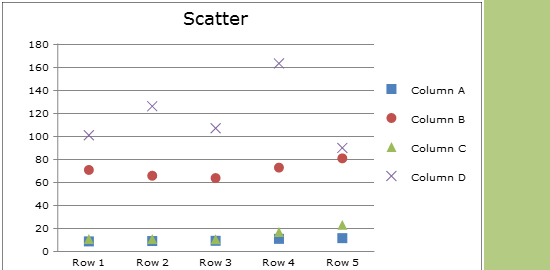 milkchart is a JavaScript charting/graphing library that requires MooTools. milkchart renders HTML data tables into one of its five types of charts: column, bar, line, scatter, and pie (with future expansions planned for area graphs) using HTML5’s Canvas element. milkchart is open source under the Apache License.
20. Timeplot
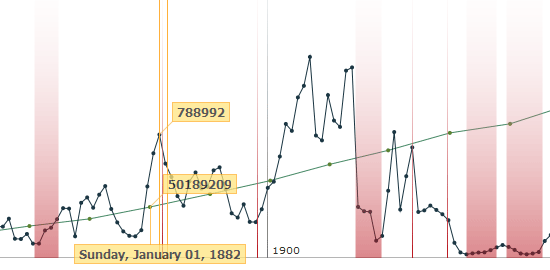 Timeplot allows you to dynamically generate time series graphs. Hovering over data points reveals their value. Timeplot was developed as part of the SIMILE Project at MIT.
Here’s a step-by-step tutorial on how to utilize Timeplot. Timeplot is open source and available the BSD license. The Timeplot demo and download links are on this page.
- Timeplot Demos and Download Info
Summary
Bringing data to life is an important part of web design. Javascript is great for any site with lots of data on it, such as a financial advisor or realtor’s website. It allows the data tables to stand out and not be so bland, so I highly recommend taking advantage of it.
Related Content
- Graphing/Charting Data on Web Pages: JavaScript Solutions
- 10 Promising JavaScript Frameworks
- 10 Impressive JavaScript Animation Frameworks
- Related categories: JavaScript and Web Development
-
 President of WebFX. Bill has over 25 years of experience in the Internet marketing industry specializing in SEO, UX, information architecture, marketing automation and more. William’s background in scientific computing and education from Shippensburg and MIT provided the foundation for MarketingCloudFX and other key research and development projects at WebFX.
 -

WebFX is a full-service marketing agency with 1,100+ client reviews and a 4.9-star rating on Clutch! Find out how our expert team and revenue-accelerating tech can drive results for you! Learn more
Make estimating web design costs easy
Website design costs can be tricky to nail down. Get an instant estimate for a custom web design with our free website design cost calculator!
Try Our Free Web Design Cost Calculator
Share this article

Web Design Calculator
Use our free tool to get a free, instant quote in under 60 seconds.
View Web Design CalculatorMake estimating web design costs easy
Website design costs can be tricky to nail down. Get an instant estimate for a custom web design with our free website design cost calculator!
Try Our Free Web Design Cost Calculator