
When you have a website or a network, it’s helpful to be aware of any issues as soon as they occur.
If you don’t, they can severely hurt your SEO strategy. There are open source and freeware server/network monitoring tools that will supervise your infrastructure for any issues that may arise.
These tools are meant to aid you in avoiding being taken offline and evaluating if your resource needs has outgrown your infrastructure. These tools are great for both lead generation sites, such as a local restaurant, and e-commerce sites, such as an auto parts retailer.
In this article, we review our top 10 server/network monitoring tools and software’s.
You will see a variety of server applications here so that you might find the tool (or tools) for your needs.
1. Monit
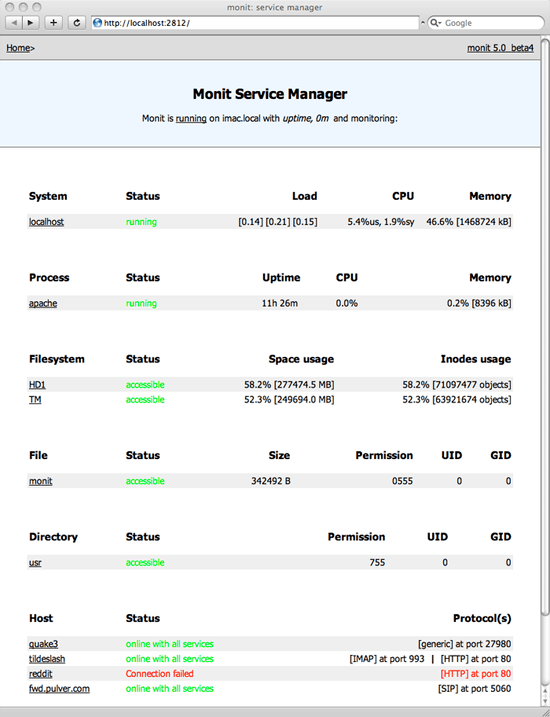
Monit not only monitors your server, but also attempts to remedy problems by taking predefined actions for certain situations. For example, if your database server crashes, Monit can automatically restart the service if this is the action that you want to take (hint: it usually is).
If you have more than one server that you need to monitor, then you can use M/Monit– an extended version of Monit that provides a simple way to monitor multiple machines. There’s also an iPhone app available for M/Monit to help you conveniently check on your network without lugging around a laptop around.
2. Ganglia
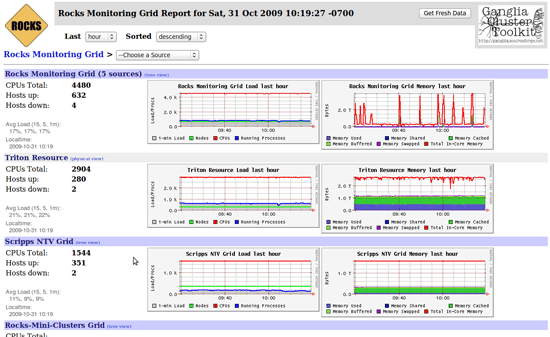
When you have a cluster of machines, it’s difficult to see how the whole cluster is doing all at once. Ganglia, instead, presents an overview of the whole cluster. This is a great tool to have set up when you’re working with a server cluster; with that said, it may be overkill for single-machine set-ups.
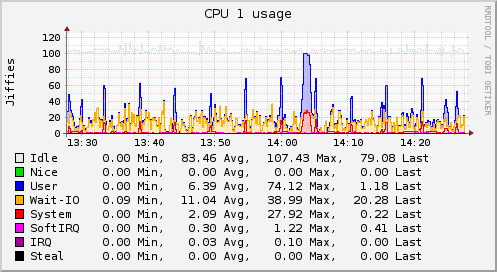
3. Munin
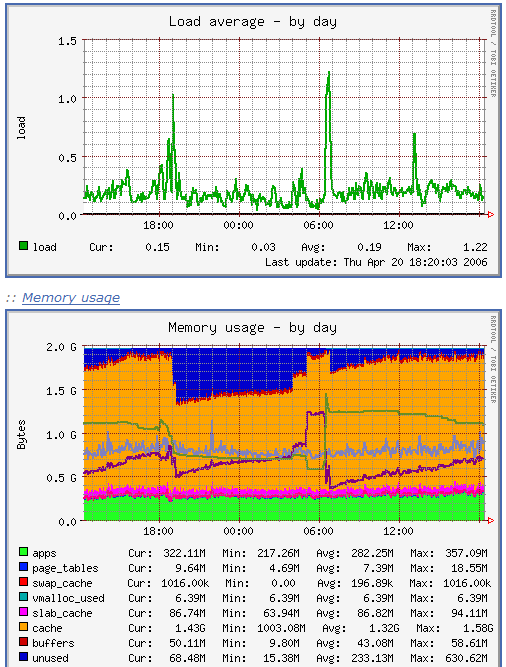
Munin monitors and graphs system performance metrics. It can automatically produce daily/weekly/monthly/yearly performance graphs and reports of many important metrics.
It comes with the ability to monitor core system resources, such as memory, disk space, CPU usage, server applications such as MySQL, Apache, and Squid. One of Munin’s greatest strengths is how simple it is to extend.
With just a few lines of code, you can write a plugin to monitor almost anything.
Being so easy to extend means that Munin is also a good choice for graphing things unrelated to server performance, such as the number of user signups or website popularity.
4. Cacti
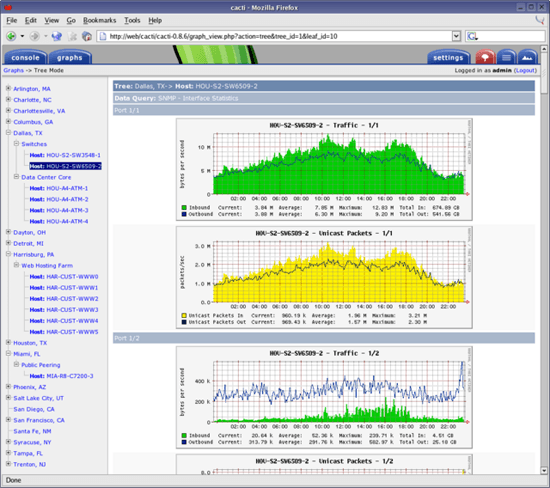
Cacti is similar to Munin in many ways.
What is makes Cacti different though–and where it stands out in relation to Munin–is that it allows you to resize your graphs and view data for an arbitrary range. Whereas Munin has fixed daily, weekly, monthly and yearly graphs (unless you write a custom extension),
Cacti lets you view your data however you want to: last 2 hours, last 4 days, last 6 months, out of the box. You can even visually select and zoom into regions on your graphs.
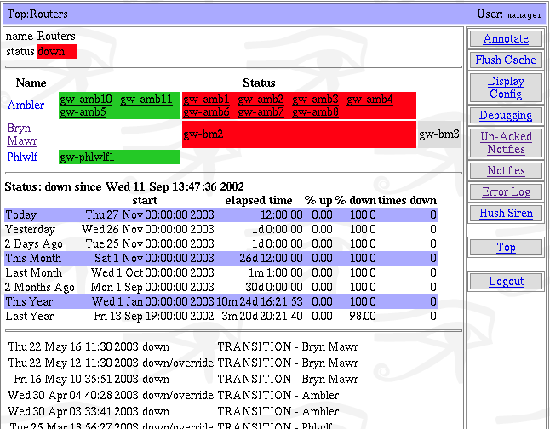
5. Nagios
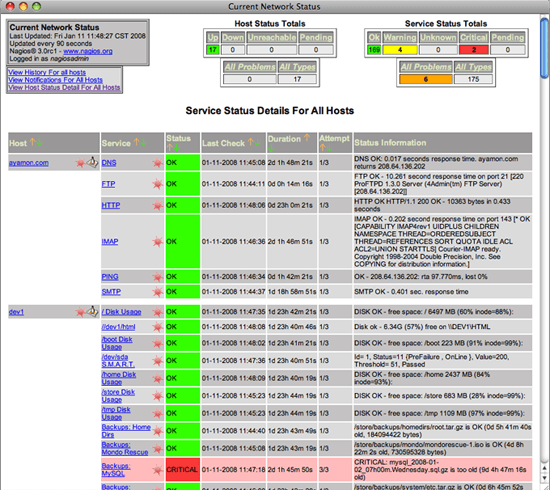
Nagios is “the industry standard in IT infrastructure monitoring,”–well, at least that’s what it says on their website. Nagios can be complicated to install and configure, but its wealth of features are unmatched by any tool out in the market and is geared for the experienced IT network administrator.
Nagios supports monitoring of multiple hosts and can send out alerts via email, pager (if you still use this ancient technology) or SMS/text messaging. Like Monit, it can also be configured to automatically respond to problems.
6. Zabbix
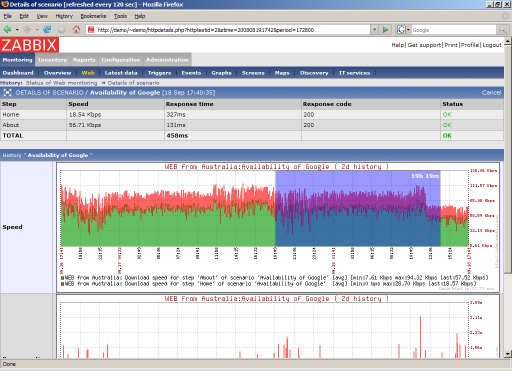
Zabbix is a feature-packed monitoring tool. It has great visualization support including user-defined views, zooming, and mapping. It can send out alerts via email, SMS or instant message.
It also provides audible alerts, which can be useful when you’re physically near the monitoring machine.
7. Observium
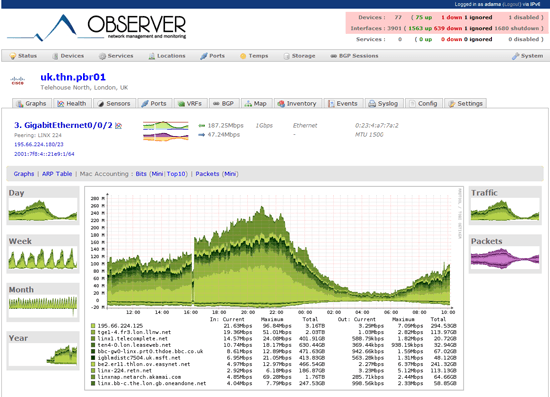
Observium is geared towards Linux, BSD and Cisco networks.
It supports auto discovery of your network infrastructure, finding the networks that you’re likely interested in monitoring; this feature can be compared to how your Wi-Fi software automatically finds signals in range that you can jack into.
Observium provides detailed graphs, and can be set up alongside Nagios to provide alerts. It also integrates well with Collectd (featured below) for a more robust interface.
8. Zenoss
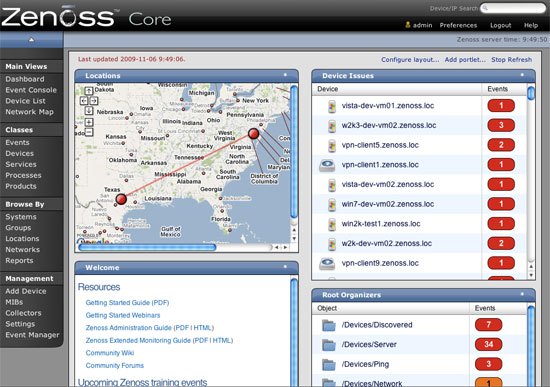
Zenoss is an open source version of the commercial server monitoring tool Zenoss Enterprise, written entirely in Python. It supports the Nagios plugin format, so many existing Nagios plugins can be used in Zenoss. One of the main highlights of Zenoss is its powerful yet simple to use user interface.
9. Collectd
Collectd is similar to Munin and Cacti in that it focuses on graphing system metrics. Where it excels in is that it is designed specifically for performance and portability; this ultimately means it’s great on rugged systems, low-end systems, and embedded systems.
Being designed for performance and low-system resource use means that Collectd can gather data every 10 seconds without interfering with your server processes, providing extremely high-resolution statistics. You can write extensions for it in C, Perl or Java.
10. Argus
Argus focuses on the monitoring of network services, and supports IPv4 and IPv6. It has a nice alert escalation procedure: after sending out an alert and the problem still isn’t resolved within a fixed amount of time (because the systems admin is at home enjoying his sleep), another alert will be sent out to someone else.
What do you use? Do you have experiences with any of the tools above? Do you use something else? Join our discussion in the comments.
Related Content
-
 President of WebFX. Bill has over 25 years of experience in the Internet marketing industry specializing in SEO, UX, information architecture, marketing automation and more. William’s background in scientific computing and education from Shippensburg and MIT provided the foundation for MarketingCloudFX and other key research and development projects at WebFX.
 -

WebFX is a full-service marketing agency with 1,100+ client reviews and a 4.9-star rating on Clutch! Find out how our expert team and revenue-accelerating tech can drive results for you! Learn more
Make estimating web design costs easy
Website design costs can be tricky to nail down. Get an instant estimate for a custom web design with our free website design cost calculator!
Try Our Free Web Design Cost Calculator
Share this article


Web Design Calculator
Use our free tool to get a free, instant quote in under 60 seconds.
View Web Design CalculatorMake estimating web design costs easy
Website design costs can be tricky to nail down. Get an instant estimate for a custom web design with our free website design cost calculator!
Try Our Free Web Design Cost Calculator